This document contains information that may be useful for developers that want to build, modify, enhance and/or debug this extension. If you only intend to consume the extension, it might be easier to get it from the public OpenVSX registry,
This project started from the VSCode webview react project. It works this way, with the extension itself being in the vscode-trace-extension directory and the react application being in the vscode-trace-webapps directory.
👋 Want to help? Read our contributor guide and follow the instructions to contribute code.
First, you need Node.js and yarn:
It's suggested to install nvm to manage node on your machine. Once that's done, install the required version:
   nvm install 18
   # optional: make it the default version
   nvm alias default
   # or set it every time like so
   nvm use 18
Then install yarn:
npm i -g yarn # the default version should be okThe code was migrated from the PR in theia-trace-extension.
It depends on the trace viewer plugins from the theia trace extension package and the tsp typescript client, as well as the timeline chart. They are all available from the NPM package registry.
- timeline-chart
- traceviewer-base
- traceviewer-react-components
- tsp-typescript-client
To build the VSCode extension, run the yarn command:
yarnThen from VSCode, press f5 to run the extension. The trace server needs to be started separately as described here.
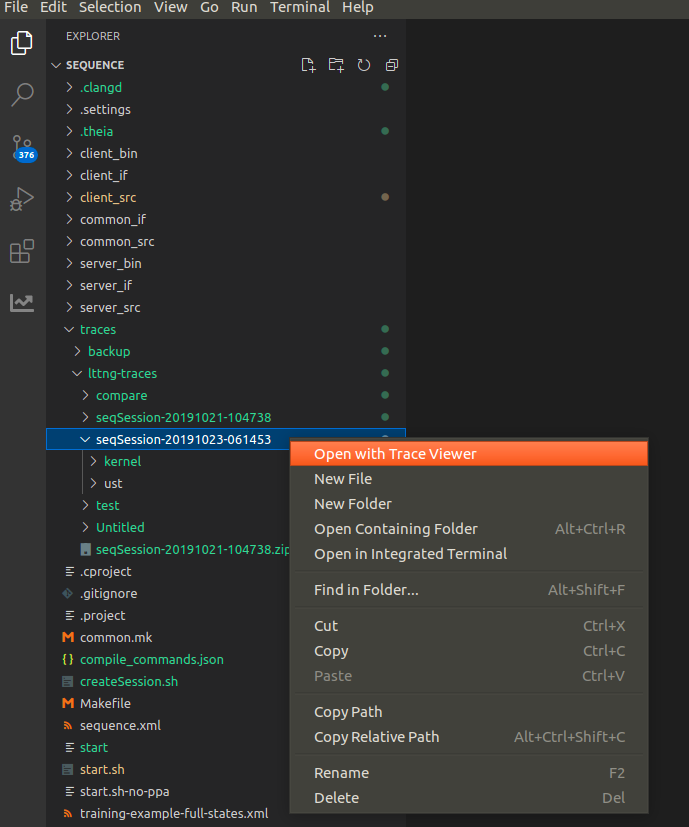
To open a trace use the VSCode file explorer to navigate to the trace directory. Then right mouse click on the trace and select menu option Open with Trace Viewer. See here to get some sample traces.
Open the Trace Viewer view (View -> Open view...).
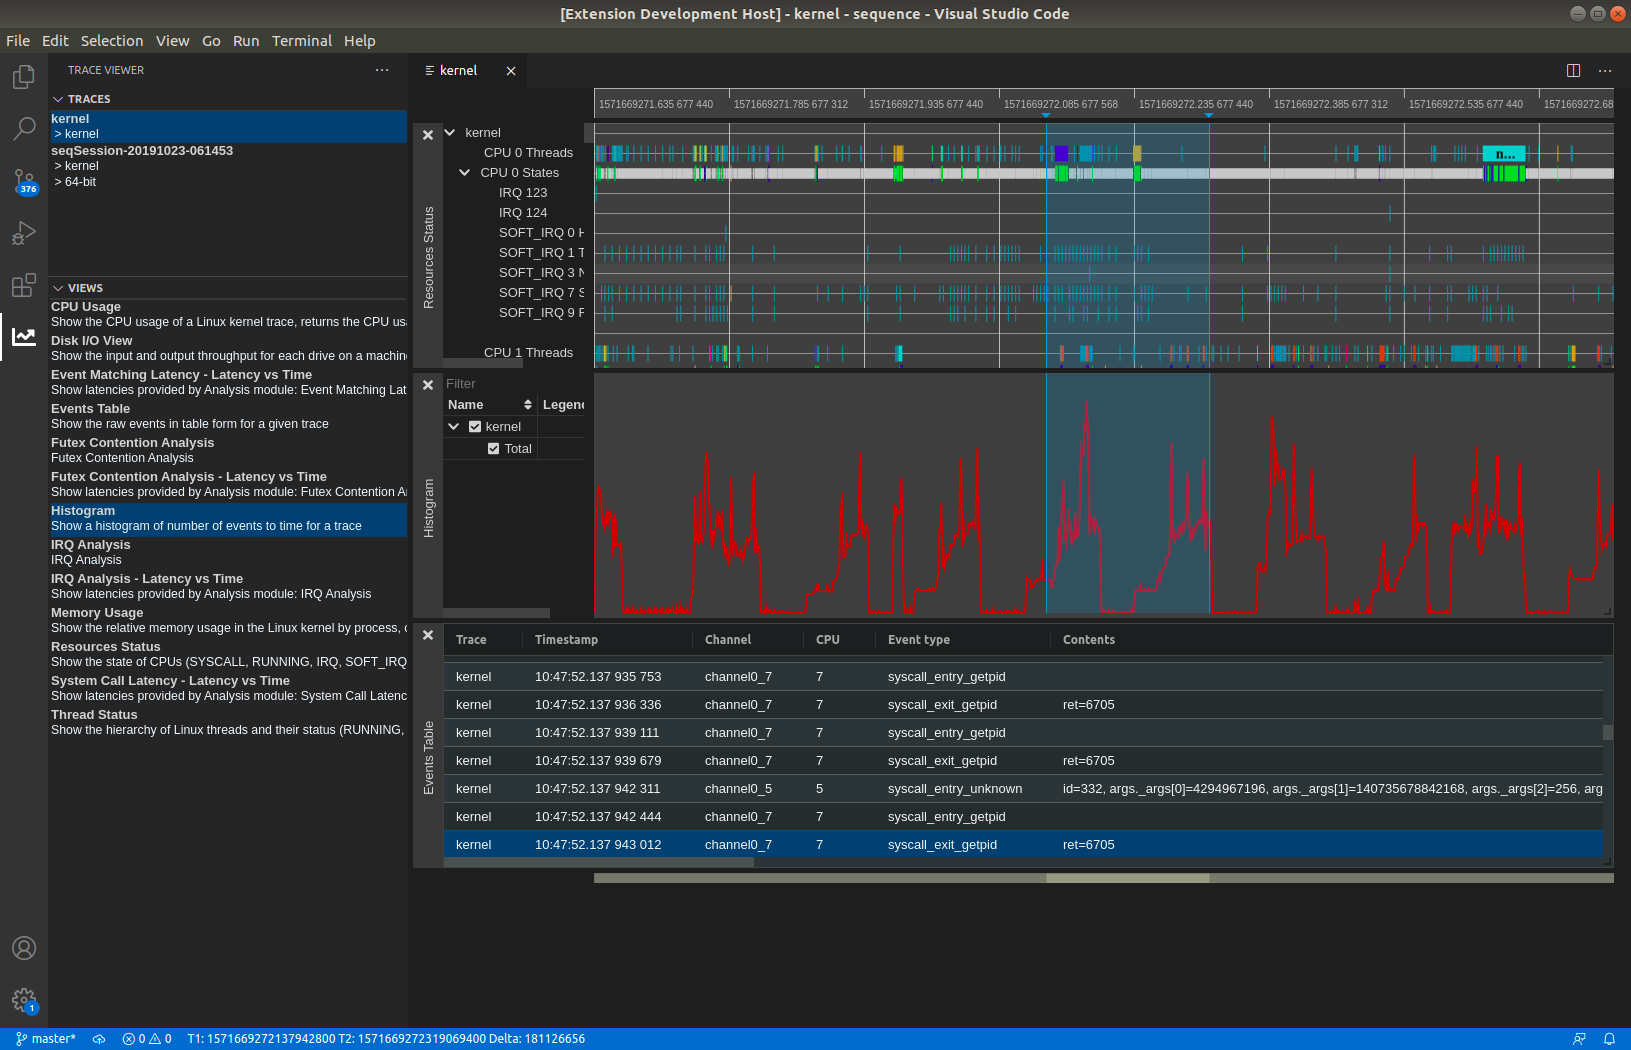
Two tabs will be visible: Traces and Views. The Traces tab will show all available traces on the trace server.
The Views tab shows all the available views for the selected trace. Click on a view to open the view under the timeline.
To package it as VSCode extension, run the command yarn vsce:package. If you get errors about case-sensitive files, just delete the node_modules folder and run yarn again.
The packaging will produce a vscode-trace-extension-x.x.x.vsix file in the subdirectory vscode-trace-extension of the repository.
The packaged VSIX file can be installed in an existing VSCode, VSCodium or Theia application by using Install from a vsix.
The trace server needs to be started separately as described here.
The packaged VSIX file can be run in the example app of the theia-trace-extension. For this the file can be can be symlinked in the plugins of the example app of theia-trace-extension repository.
cd <theia-trace-extension root>/examples/plugins
ln -s <vscode-trace-extension root>/vscode-trace-extension-x.x.x.vsix ./From the root directory execute yarn run watch. This will watch and bundle vscode-trace-common, vscode-trace-extension, and vscode-trace-webviews. All outputs will be in one terminal. Changes can be observed and tested in the Extension Development Host by pressing F5.
For more information about VSCode WebView API see here.
To communicate between VSCode extension and webviews use the VSCode message API. When using vscode.postMessage(data) data structure data will be serialized to JSON before being propagated. Be aware that it cannot include data structures like BigInt. Proper handling of such data structures need to be implemented when sending and receiving messages.
Inside a webview or inside the extension signals can be used where data structures can be passed on.
The following sequence diagram shows how the experiment-selected signal (with payload Experiment) is propagated inside the application. The webview Opened Traces WebView App is sending the signal to theVSCode extension which is forwarding the signal to the Available Views WebView App.
sequenceDiagram
    actor User
    participant reactOpenTraces as ReactOpenTracesWidget
    participant explorerOpenTraces as TraceExplorerOpenedTraces
    participant exOpenTraceProvider as TraceExplorerOpenedTracesViewProvider
    participant exViewsAvailProvider as TraceExplorerAvailableViewsProvider
    participant explorerAvailView as TraceExplorerViewsWidget
    participant reactAvailViewsexplorerOpenTraces as ReactAvailableViewsWidget
    participant server as Trace Server
    User->>reactOpenTraces: click on trace
    Note over reactOpenTraces,explorerOpenTraces: Opened Traces WebView App
    Note over exOpenTraceProvider,exViewsAvailProvider: VsCode extension
    Note over explorerAvailView,reactAvailViewsexplorerOpenTraces: Available Views WebView App
    reactOpenTraces->>explorerOpenTraces: sendSignal(exp-sel)
    explorerOpenTraces->>exOpenTraceProvider: vscode.postMessage(exp-sel)
    exOpenTraceProvider->>exViewsAvailProvider: sendSignal(exp-sel)
    exViewsAvailProvider->>explorerAvailView: vscode.postMessage(exp-sel)
    explorerAvailView->>reactAvailViewsexplorerOpenTraces: sendSignal(exp-sel)
    reactAvailViewsexplorerOpenTraces->>server: fetchOutputs(exp)
    server->>reactAvailViewsexplorerOpenTraces: success(200)
    reactAvailViewsexplorerOpenTraces->>reactAvailViewsexplorerOpenTraces: visualize availableViews
It is straightforward to debug the code of the VSCode extension itself (the code in vscode-trace-extension) by just putting breakpoints in VSCode and running the extension with f5.
The react-app is another matter. The panel is a webview that is running in its own context, so current VSCode does not have access to it. (Patches welcome!)
Each panel is its own small web application, so to debug, while in the context of the webview, press ctrl-shift-p and enter the command Developer: Open Webview Developer Tools. This will open the developer tools. The code is in the Sources tab of the developer tools window that opens.
The extension uses an output channel for logging. To view the logs, navigate to the output panel. The output panel can be accessed by navigating to view -> open view -> type 'output'. To open the extension output channel, navigate the drop down option and look for Trace Extension. An alternate way of opening the trace extension output channel is through command palette. Open command palette by pressing ctrl-shift-p, and then run Output: Show Output Channels...\. This will prompt a list of available outputs. Select Trace Extension from the list of available outputs.
For logging to the Trace Extension output channel, use the traceLogger object instantiated in extension.ts. The following are examples of using the log channel:
traceLogger.addLogMessage('Hello from trace extension without tag');This will add the following log entry in the output channel:
[2023-04-25 11:07:22.500] Hello from trace extension without tag
traceLogger.addLogMessage('Hello from trace extension with tag', 'tag');This will add the following log entry in the output channel:
[2023-04-25 11:08:40.500] [tag] Hello from trace extension with tag
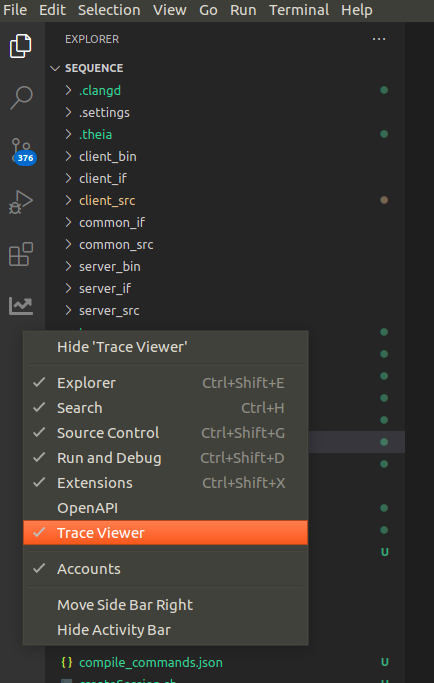
*The Trace Viewer panel is not there, or disappears when switching panel.
Right-click on the vscode activity bar and make sure Trace Viewer is checked.
In order to open traces, you need a trace server running on the same machine as the trace extension. You can download the Eclipse Trace Compass server or let yarn download and run it:
yarn download:server
yarn start:server
You can also build the trace-server yourself using Trace Compass and the Incubator. Take a look at the instructions here.
To get sample traces to try run the following command. The traces will be stored under the subdirectory TraceCompassTutorialTraces of the repository.
yarn download:sample-tracesTo run the UI tests locally, use the following commands.
Steps for setup that only need to be run once:
yarn download:sample-traces
yarn download:server
yarn download:openvscode-server
yarn configure:openvscode-server
yarn playwright install --with-deps
Steps to run once and again every time the application code is modified:
yarn
yarn vsce:package
# kill openvscode-server if running and restart it below
Steps to run once if the corresponding server is not already running:
yarn start:server & # or run in a separate shell
yarn start:openvscode-server & # or run in a separate shell
To run or re-run the tests after test code is modified:
yarn playwright testTo test in debug mode, test with tracing on, or test with retries on failure, use the following options:
yarn playwright test --debug
yarn playwright test --trace on
yarn playwright test --retries <retries>VSCode Trace Extension provides an external API that adopter extensions can rely on for communication. Currently the API is limited to the following:
getActiveExperiment(): Experiment | undefined
getActiveWebviewPanels(): { [key: string]: TraceViewerPanel | undefined; }
getActiveWebviews(): vscode.WebviewView[]
onWebviewCreated(listener: (data: vscode.WebviewView) => void): void
onWebviewPanelCreated(listener: (data: vscode.WebviewPanel) => void): void
onSignalManagerSignal(event: string | symbol, listener: (...args: unknown[]) => void): void;
offSignalManagerSignal(event: string | symbol, listener: (...args: unknown[]) => void): void;
addTraceServerContributor(contributor: TraceServerContributor): void;
setHandleTraceResourceType(handleFiles: boolean, handleFolders: boolean): void;//The following retrieves the API object from the vscode-trace-extension
const ext = vscode.extensions.getExtension("eclipse-cdt.vscode-trace-extension");
const importedApi = ext.exports;Once you have the API object, you can proceed to make API calls. For example, if you wish to retrieve the active experiment in the Trace Viewer, the following API call can be used:
const experiment = importedApi.getActiveExperiment();The API provides getters to retrieve the active webviews and panels. This can be useful for scenarios when webviews/panels were created before the adopter extension was activated but the adopter extension still wants to handle messages from them.
for (const webview of importedApi.getActiveWebviews()) {
    webview.webview.onDidReceiveMessage((message) => {
        switch (message.command) {
            case "webviewReady":
            console.log("From adopter extension - webviewReady signal received");
            break;
            default:
            break;
        }
    });
}
The API also provides a way to attach a listener for when webview or webview panel is created. Note that this listener will not be called for webviews and panels created before the registration of the listener. It is recommended to register the listeners during the activation of the adopter extensions.
importedApi.onWebviewPanelCreated(_panel => {
    // For newly created panel, handle messages from webviews
    _panel.webview.onDidReceiveMessage((message) => {
        switch (message.command) {
            case "webviewReady":
            console.log("From adopter extension - webviewReady signal received");
            break;
            default:
            break;
        }
    });
    _panel.onDidDispose(() => {
        console.log("panel disposed");
    });
});
As a general rule, adopter extensions should retrieve and handle the webviews and webview panels once during their activation by calling getActiveWebviews and getActiveWebviewPanels. This ensures that the webviews and panels created before the activation of the adopter extension are handled. To handle any new webviews and panels created afterwards, listeners can be registered by calling onWebviewCreated and onWebviewPanelCreated.
The adopter extensions can also add and remove listeners to signals propagated within the base extension.
const _onExperimentOpened = (experiment: Experiment): void => {
    console.log(experiment.UUID);
};
//Add a listener
importedApi.onSignalManagerSignal('experiment opened', _onExperimentOpened);
//Remove a listener
importedApi.offSignalManagerSignal('experiment opened', _onExperimentOpened);
If the adopter extensions needs to add a custom hook to the trace server's start/stop API, a contribution can be made by calling addTraceServerContributor.
const contributor: TraceServerContributor = {
    startServer: async () => {
        //Perform pre-startup actions
        //Start the server
        console.log("server started");
        },
    stopServer: async () => {
        //Perform cleanup actions
        //Stop the server
        console.log("server stopped");
    },
    isApplicable: (pathToTrace: string) => {
        //Check whether this contributor applies for the trace at 'pathToTrace'
        return true;
    }
  };

importedApi.addTraceServerContributor(contributor);
If adopter extensions want to customize the type of trace resources (File and/or Folder) that the base extension should handle, it can be set by calling setHandleTraceResourceType.
const handleTraceFiles = true;
const handleTraceFolders = false;

//The base extension will only provide support for trace files, and not for trace folders
importedApi.setHandleTraceResourceType(handleTraceFiles, handleTraceFolders);The Trace Viewer for VSCode extension is compatible with the use of remote-ssh. If you are using remote-ssh, you can simply install Trace Viewer for VSCode extension on your remote machine and begin using the extension.
The remote support works by forwarding the Trace Server's operating port from the client machine to the remote machine. The port is automatically forwarded on Trace Server startup.
Forwarded ports can be seen in the 'Ports' view of the remote VsCode. To open the Ports view use menu View -> Open view... -> Ports. You should see the forwarded Trace Server port in the Ports view, as shown below:
Make sure that there is no Trace Server running on your local host. If the Trace Viewer for VSCode is unresponsive, stop the port forwarding by pressing the 'Stop Port Fowarding (Delete)' of the trace server port and restart remote VSCode.
If you are a developers of the Trace Viewer for VsCode and want to modify and test the extension, you can package it as a VSCode extension (.vsix), upload the VSIX to the remote host and install the extension using the Install from VSIX... view menu of the Extensions view.
We use GitHub CI to create a GitHub release and the corresponding git tag, and also to publish this repo's VSCode extension to the open-vsx.org and the Visual Studio Marketplace registries.
Whenever a new release is desired, it can be triggered through a PR, as per the following:
Create a new branch for your PR, based on the repo's latest state. e.g.
git branch new-release && git checkout new-releaseThen decide if the release shall be a Major, Minor or Patch release and use the corresponding command below to step the package's versions, according to the release type. A new release commit will be created:
yarn version:major
# or
yarn version:minor
# or
yarn version:patch
Modify the version tag in file ./RELEASE, to match the new release. Amend the release commit to include this change:
git add RELEASE && git commit --amendFinally, push the branch to the main repository (not a fork!) and use it to create a PR. When the PR is merged, a GitHub release should be created with auto-generated release notes, as well as a git tag. Then the publish-* CI jobs should trigger, and if everything goes well, publish the new version of the extension to both registries.